SupermokuThis is a completely custom Ichimoku Cloud indicator bundle and strategy backtested on all BTC fiat pairs with impeccable results. The profit factor can only get so high. This is the crème de la crème of Ichimoku Cloud.
In den Scripts nach "profit factor" suchen

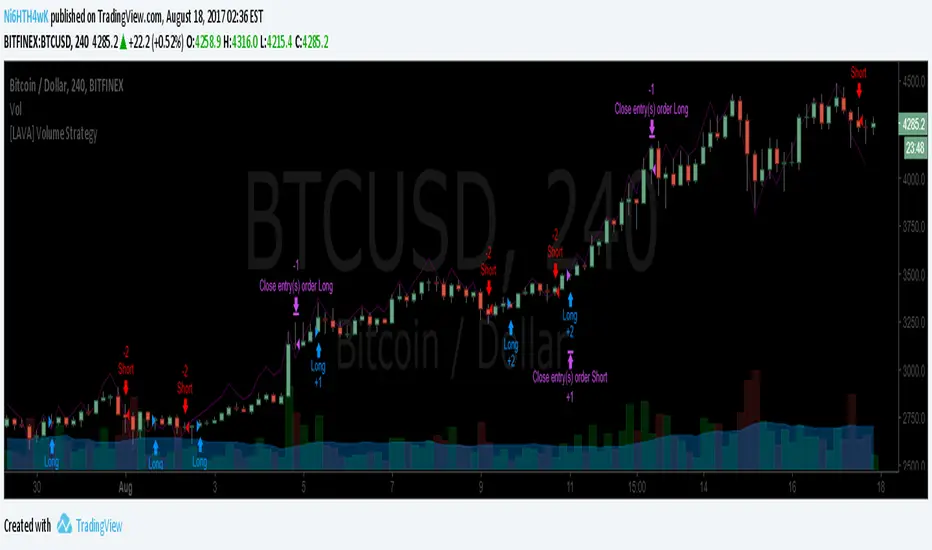
[LAVA] Volume StratA volume strategy indicator based off the size of the individual volume candles. Backtest to figure out which method works the best for your chart. A higher Profit Factor is what you want to look for since you want to trade less with better results for an overall lower commissioning fee.
Also, please contact me if there is any other indicator you would be interested in seeing as a strategy. I can do them all.
Please send your donation to any of the following addresses. Don't forget to add your TV name to the message when donating so that I can unlock the script for you. You can also send me a pm with your donation amount.
BTC: 1EabcghxBLZmGKHmKEP9W6S5ZSKeG4wLFA
BCH: 1M4QS5HE82Mk17ghKhaDeaXinL9CkLnhhR
LTC: LYaGjVAXGSLgTNiH7FbceP7ny4F4U8KWyN
ETH: 0x836ced779a10975248f847cad033c405a639b565
DASH: XhQexkwQUyDbvX4Xw78FHnxPvEsyRJYFqv
Click here for more information on these various cryptocurrencies listed above and others.
[LAVA] OBV stratAn OBV strategy indicator. Included is a method to show the RSI or Oscillator value. Backtest to figure out which method works the best for your chart. A higher Profit Factor is what you want to look for since you want to trade less with better results for an overall lower commissioning fee.
Also, please contact me if there is any other indicator you would be interested in seeing as a strategy. I can do them all.
Please send your donation to any of the following addresses. Don't forget to add your TV name to the message when donating so that I can unlock the script for you. You can also send me a pm with your donation amount.
BTC: 1EabcghxBLZmGKHmKEP9W6S5ZSKeG4wLFA
BCH: 1M4QS5HE82Mk17ghKhaDeaXinL9CkLnhhR
ETH: 0x836ced779a10975248f847cad033c405a639b565
DASH: XhQexkwQUyDbvX4Xw78FHnxPvEsyRJYFqv
Click here for more information on these various cryptocurrencies listed above and others.

yuthavithi BB Scalper 2 strategyIf you are searching a high win rate strategy with good profit factor ratio strategy. this one may be your choice.
Designed to be used with BTC or LTC. with 5 minute time frame or less. This BB strategy achieve win rate over 50% easily, with some tuning you can get even 60%+.

EMA Crossover with Volume + Stacked TP & Trailing SLI am relatively new here. Here is my humble contribution to the community. Simple does it! Ema 21,55 with volume. Surprisingly high win rates and good profit factors on USDJPY, EURJPY, BTCUSD, XAGUSD,XAUUSD, USOIL, USDCAD, EURGBP and AUDNZD. I cannot write a single line of code. I used Copilot for this.

Machine Learning RSI Bands V3The Machine Learning RSI Bands V3 is a cutting-edge trading tool designed to provide actionable insights by combining the strength of machine learning with a traditional RSI framework. It adapts dynamically to changing market conditions, offering traders a robust, data-driven approach to identifying opportunities.
Let’s break down its functionality and the logic behind each input to give you a clear understanding of how it works and how you can use it effectively.
RSI Parameters RSI Source (rsisrc): Choose the data source for RSI calculation, such as the closing price. This allows you to focus on the specific price data that aligns with your trading strategy. RSI Length (rsilen): Set the number of periods used for RSI calculation. A shorter length makes the RSI more reactive to price changes, while a longer length smooths out volatility. These inputs allow you to customize the foundational RSI calculations, ensuring the indicator fits your style of trading.
Band Limits Lower Band Limit (lb): Defines the RSI value below which the market is considered oversold. Upper Band Limit (ub): Defines the RSI value above which the market is considered overbought. These settings give you control over the thresholds for market conditions. By adjusting the band limits, you can tailor the indicator to be more or less sensitive to market movements.
Sampling and Reaction Settings Target Reaction Size (l): Determines the number of bars used to define pivot points. Smaller values react to shorter-term price movements, while larger values focus on broader trends. Backtesting Reaction Size (btw): Sets the number of bars used to validate signal performance. This ensures signals are only considered valid if they perform consistently within the specified range. Data Format (version): Choose between Absolute (ignoring direction) and Directional (incorporating directional price changes). Sampling Method (sm): Select how the data is analyzed—options include Price Movement, Volume Movement, RSI Movement, Trend Movement, or a Hybrid approach. These settings empower you to refine how the indicator processes and interprets data, whether focusing on short-term price shifts or broader market trends.
Signal Settings Signal Confidence Method (cm): Choose between: Threshold: Signals must meet a confidence limit before being generated. Voting: Requires a majority of 5 signal components to confirm a trade. Confidence Limit (cl): Defines the confidence threshold for generating signals when using the Threshold method. Votes Needed (vn): Sets the number of votes required to confirm a trade when using the Voting method. Use All Outputs (fm): If enabled, signals are generated without filtering, providing an unfiltered view of potential opportunities. This section offers a balance between precision and flexibility, enabling you to control the rigor applied to signal generation.
How It Works
The script uses machine learning models to adaptively calculate dynamic RSI bands. These bands adjust based on market conditions, providing a more responsive and nuanced interpretation of overbought and oversold levels.
Dynamic Bands: The lower and upper RSI bands are recalibrated using machine learning to reflect current market conditions. Signals: Long and short signals are generated when RSI crosses these bands, with additional filters applied based on your chosen confidence method and sampling settings. Transparency: Real-time success rates and profit factors are displayed on the chart, giving you clear feedback on the indicator's performance.
Why Use Machine Learning RSI Bands V3?
This indicator is built for traders who want more than static thresholds and generic signals. It offers:
Adaptability: Machine learning dynamically adjusts the indicator to market conditions. Customizability: Each input serves a specific purpose, giving you full control over its behavior. Accountability: With built-in performance metrics, you always know how the tool is performing.
This is a tool designed for those who value precision and adaptability in trading.

DDAP
This strategy is designed to assist in reducing ownership of assets during downward or sideways movements, thus potentially improving the profit factors of said investments over a long-time horizon.
This strategy analyzes the changes of an underlying security over multiple timeframes. It then computes a value for defining how strong or weak a specific trend may be. This is referred to as the momentum. Once the momentum is accounted for, the strengths or weaknesses can be defined as the signal. Considering the momentum and the signal, we can then define the trend. The trend is displayed through a positive and negative background (green and red). If there is no background color designation, it is a neutral trend. The specific price inflection where the trend would switch to go to neutral prior to switching direction is marked by the orange line.
After the trend is defined. We then use the VAMP ( Volatility Adjusted Market Projections) to find overbought or oversold points to enter the position. The colored bands, red being overbought, and green being oversold are displayed on the chart.
The objective of the strategy is to buy when the trend is green and the price is oversold (at the green line) or short when the trend is red and the price is overbought (at the red line).
Use the link below to obtain access to this indicator. Thank you
*This is not a strategy that claims any realized returns or an emphasis on potential returns. Any returns achieved with this strategy are not guaranteed and should not be indicative of future results. Nor should this be used as the sole decision prior to making an investment or as investment advice*

Line Break StrategyLine Break Strategy
Entry rule:
Long on a bullish line and short on a bearish line.
Backtest:
Profit factors are shown below for three-line break.
Daily time frame, FXCM broker.
EURUSD: 1.267, USDJPY: 1.039, GBPUSD: -0.816, AUDUSD: -0.959
S&P500: -0.783, Nikkei225: 1.099
CrudeOil: 1.03, Gold: 1.196
BTCUSD: -0.883
Reference:
Steve Nison, Beyond Candlesticks - New Japanese Charting Techniques Revealed
Note:
This strategy doesn't work properly on the linebreak chart.
A good example is shown below. The entry prices are not always correct.
If you have signal, but the next candle moves in the opposite direction, the entry price is drawn at the Open of the new candle instead of the Close of the previous candle.
The results of backtest are unreliable due to this reason.
